
 Contact
 Comment faire ses achats
Livraison
Guide d'achat
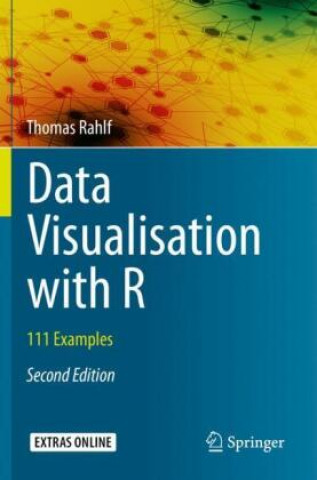
Data Visualisation with R
 Anglais
 130 b
130 b
 Livraison à Autriche
Jusqu'à 30 jours pour les retours
Les clients ont également acheté




 /
/
 Livre relié
 181.29
€
181.29
€



 /
Livre de poche
28.69
€
/
Livre de poche
28.69
€














This book introduces readers to the fundamentals of creating presentation graphics using R, based on 111 detailed and complete scripts. It shows how bar and column charts, population pyramids, Lorenz curves, box plots, scatter plots, time series, radial polygons, Gantt charts, heat maps, bump charts, mosaic and balloon charts, and a series of different thematic map types can be created using R's Base Graphics System. Every example uses real data and includes step-by-step explanations of the figures and their programming. This second edition contains additional examples for cartograms, chord-diagrams and networks, and interactive visualizations with Javascript. The open source software R is an established standard and a powerful tool for various visualizing applications, integrating nearly all technologies relevant for data visualization. The basic software, enhanced by more than 14000 extension packs currently freely available, is intensively used by organizations including Google, Facebook and the CIA. The book serves as a comprehensive reference guide to a broad variety of applications in various fields. This book is intended for all kinds of R users, ranging from experts, for whom especially the example codes are particularly useful, to beginners, who will find the finished graphics most helpful in learning what R can actually deliver.


À propos du livre
Anglais

Offrez ce livre dès aujourd'hui
C’est simple
1 Ajouter au panier et choisir l'option Livrer comme cadeau à la caisse. 2 Nous vous enverrons un bon d'achat 3 Le livre arrivera à l'adresse du destinataireCeci pourrait également vous intéresser




 /
Livre relié
25.09
€
/
Livre relié
25.09
€












Bonjour ! Je suis Libroamiko, votre conseiller littéraire.
Comment puis-je vous aider ?